
list_alt
Consider this list, what do you see?
| Age | Athlete | Sport | Notable Milestone | Year Achieved |
|---|---|---|---|---|
| 41 | Eamonn Coghlan | Track | Sub-4-minute mile | 1994 |
| 41 | Dara Torres | Swimming | 3 Olympic silver medals | 2008 |
| 44 | Yekaterina Podkopayeva | Track | World Indoor 1500m gold | 1997 |
| 45 | Sean Yates | Cycling | National 50-mile TT podium | 2005 |
| 47 | Nick Craig | Cycling | National mountain bike titles | 2016 |
| 49 | Bernard Hopkins | Boxing | Oldest world champion | 2014 |
| 50 | Phil Mickelson | Golf | Oldest major championship winner | 2021 |
| 56 | Kazuyoshi Miura | Football | Oldest active professional player | 2023 |
| 64 | Diana Nyad | Swimming | Cuba to Florida swim (no cage) | 2013 |
| 73 | Ed Whitlock | Marathon | Sub-3-hour marathon | 2004 |
| 82 | Sister Madonna Buder | Triathlon | Oldest Ironman finisher | 2012 |
| 85 | Hiroo Tanaka | Track | 15.19s 100m sprint | 2016 |
| 90 | Olga Kotelko | Track & Field | 30+ Masters world records | 2009 |
| 92 | Mathea Allansmith | Running | Oldest female 10K finisher | 2022 |
| 99 | Tom Moore | Walking | 100 garden lengths for charity | 2020 |
| 100 | Fauja Singh | Marathon | First centenarian marathon finisher | 2011 |
| 103 | Robert Marchand | Cycling | Climbed Col Robert Marchand | 2014 |
What I see is that although performance declines with age, age itself is no barrier to success. You can probably be nationally competitive at 50 years… provided you don’t begin training at 45 years! What I am trying to say, is that in my opinion training and historical habits and current daily habits count more than simple age. Age is a number. You can almost ignore it. Now, can I prove it? First, let’s start with the bad news… what declines are typical with ageing?
accessibility_new
Headline Physical Changes
Here are key physiological changes limiting performance with age (somewhat simplified and assuming training is static!):
| # | Physiological Variable | Estimated Rate of Decline | Corrected / Updated Context | Performance Impact |
|---|---|---|---|---|
| 1 | Height | ~1 cm per decade after age 40. | Due to compression of intervertebral discs and postural changes. | Alters centre of gravity and biomechanical leverage. |
| 2 | Body Fat | Increases ~1–2% per decade. | Visceral fat increases while lean body mass decreases, shifting overall composition. | Decreases power-to-weight ratio; increases metabolic cost of movement. |
| 3 | Muscle Mass | Decreases 3–8% per decade after age 30. | Accelerates after age 60. Primarily affects Type II (fast-twitch) muscle fibres. | Reduces absolute force generation and basal metabolic rate. |
| 4 | Muscle Strength | Decreases ~1–1.5% per year after age 50. | Strength declines faster than muscle mass due to neurological changes and fibre quality degradation. | Limits maximal lifting capacity, sprinting speed, and force output. |
| 5 | Muscle Power | Decreases ~3–4% per year after age 60. | Power (force x velocity) drops at roughly twice the rate of absolute strength due to preferential loss of fast-twitch fibres. | Impairs explosive movements, jumping, and rapid recovery from balance loss. |
| 6 | Melanocytes | Decreases ~10–20% per decade (~1-2% annually). | Epidermis thins and melanocyte number drops, reducing melanin production. | Increases susceptibility to UV damage and slightly impairs thermoregulation (sweat gland function also declines). |
| 7 | VO2 Max | Decreases ~10% per decade after age 25. | Highly dependent on training status. Trained athletes typically see a slower decline (~5% per decade) until age 70. | Reduces maximal aerobic threshold and endurance capacity. |
| 8 | Maximal Heart Rate | Decreases ~0.7 bpm per year. | The primary driver of VO2 max decline. A more accurate formula for adults over 40 is 208 – (0.7 × age). | Limits maximal cardiac output during peak exertion. |
| 9 | Stroke Volume / Cardiac Output | Stroke volume declines ~10–20% by age 80. | Ejection fraction at rest remains relatively stable in healthy ageing. SV drops at maximal exertion due to increased arterial stiffness and slower ventricular filling, not primarily ejection fraction. | Restricts the volume of blood and oxygen delivered to working muscles per beat. |
| 10 | Blood O2 Capacity | Negligible decline in healthy individuals. | Haemoglobin and haematocrit remain relatively stable in healthy ageing. The peripheral decline in oxygen extraction (a-vO2 difference) is primarily due to reduced capillary density and mitochondrial volume, not blood O2 capacity. | Reduces peripheral oxygen utilisation. |
| 11 | Forced Vital Capacity (FVC) | Decreases ~20–30 ml per year (200–300 ml per decade). | Caused by loss of chest wall elasticity and weakened respiratory muscles. | Limits maximal lung expansion and tidal volume during exercise. |
| 12 | MVV & Diffusion Capacity | MVV: ~6% per decade. Diffusion: ~5% per decade. | Alveolar surface area decreases, limiting the speed at which oxygen crosses into the blood. | Contributes to exercise-induced arterial hypoxaemia at maximal effort. |
| 13 | Bone Mineral Density | Decreases ~1% per year after age 40. | Accelerates in women post-menopause (up to 2-3% annually for 5 years). | Increases risk of stress fractures and limits capacity to absorb high-impact forces. |
| 14 | Nerve Conduction Velocity | Decreases ~1% per year after age 50. | Demyelination and loss of motor neurons slow signal transmission from brain to muscle. | Slows reaction times, reduces coordination, and impairs agility. |
| 15 | Endocrine Function | Testosterone drops ~1% per year after 30. | Growth hormone and IGF-1 also decline (somatopause), impairing protein synthesis. | Slows recovery times, blunts hypertrophy response, and reduces aggression/drive. |
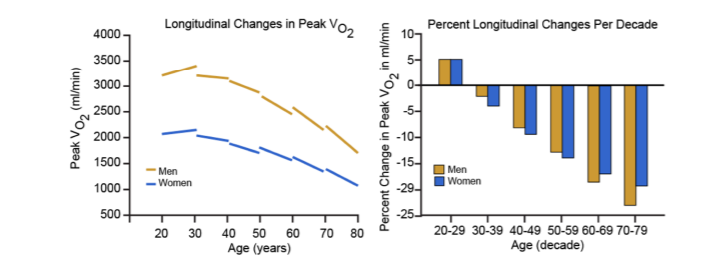
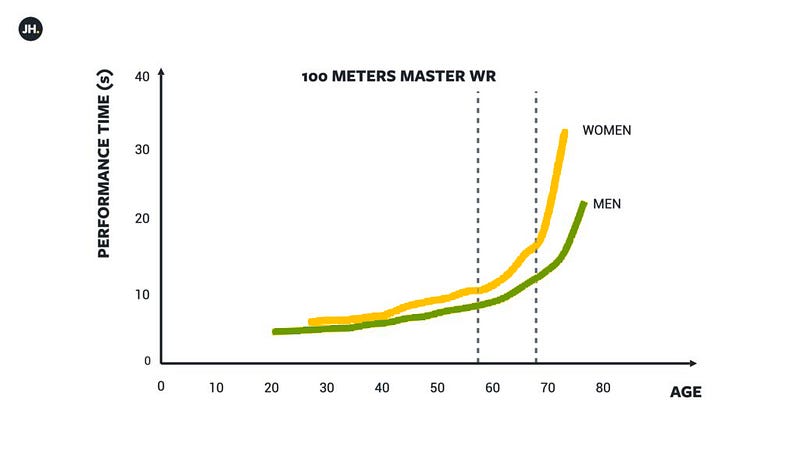
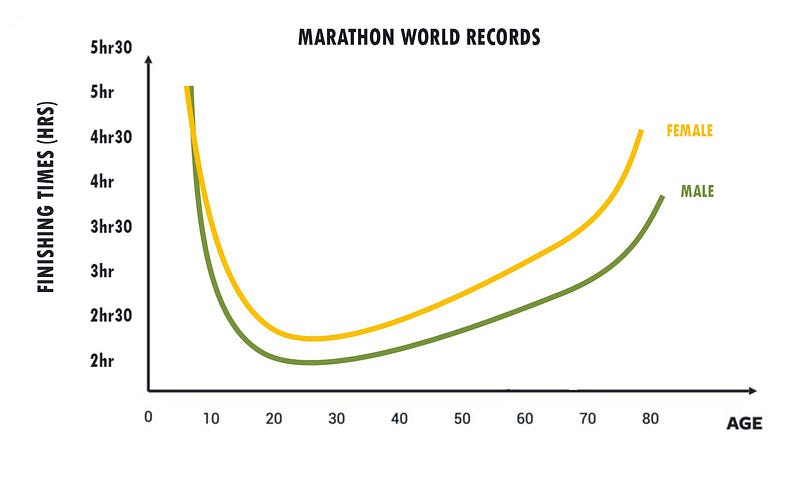
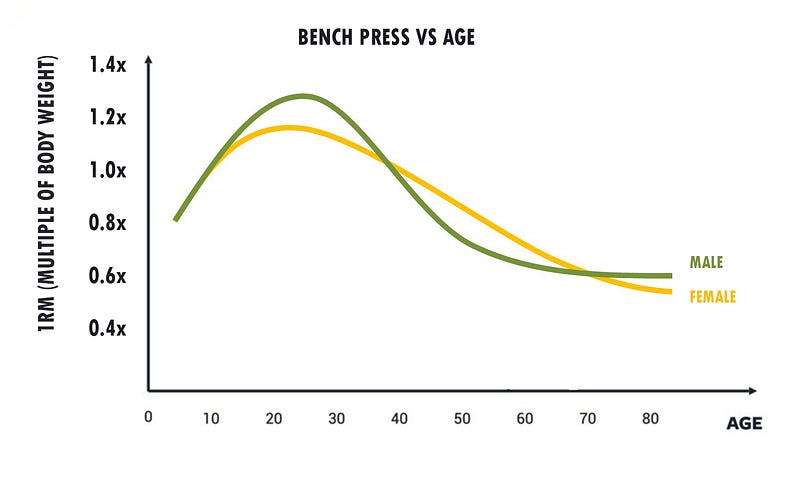
Now let’s look at aerobic (cycling/running) and anaerobic (lifting/strength) changes with age. If we look in more detail, the story is not that simple. It is not a straight line.
monitor_heart
Aerobic Fitness vs Age
If we track performance by age closely in the lab or in the field we see this:
VO2 max vs Age
100m vs Age
Marathon vs Age
Strength vs Age
Big Data (Strength)
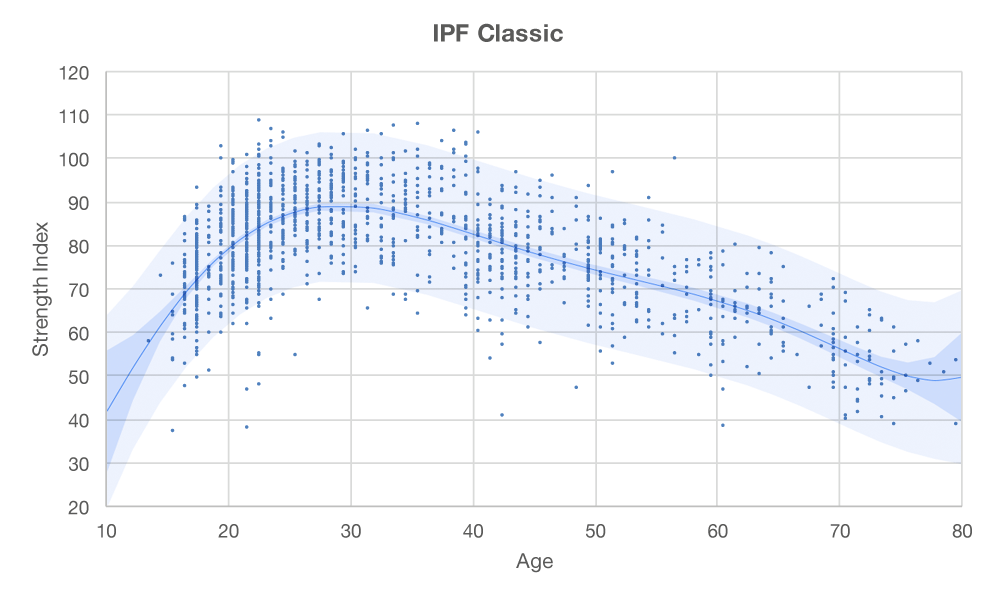
The last figure is interesting because it comprises all the primary data from 1500 individuals. With this, it is possible to look at the contribution of age to curve fit which is roughly the same as asking:
What % of the variation in strength is due to ageing itself?
The answer is it depends on how much is due to other factors such as genetics, training history etc, but in beginners, the effect of age is only 2–5% and in elites it might be 40% (and in the middle maybe around 10–20%). If you write down all contributory factors, then it looks something like this (for those starting out):
What determines variations in strength or endurance?
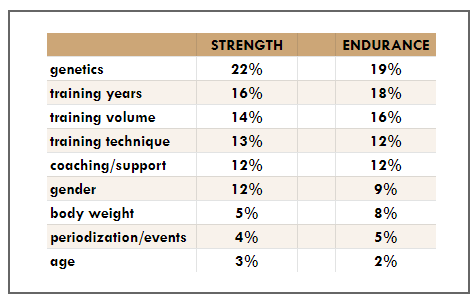
Genetics seems to be the largest effect (linkcitation). Now, we should examine these training effects in more detail, what we want to know is whether training is more effective at a younger or older age?
fitness_center
Training Effect with Age
Given that genetics, age and gender are fixed variables, and discounting the historical effect of what you did in the past (training years), then current training/coaching/events might contribute 65% of the variance in performance!
When you train, no doubt you get a big effect, provided you don’t give up of course. The effect is usually much larger than the effect of age alone. We can show this with real data. Here is the effect of training (elite vs just started within 6 months) on the strength index of real athletes:
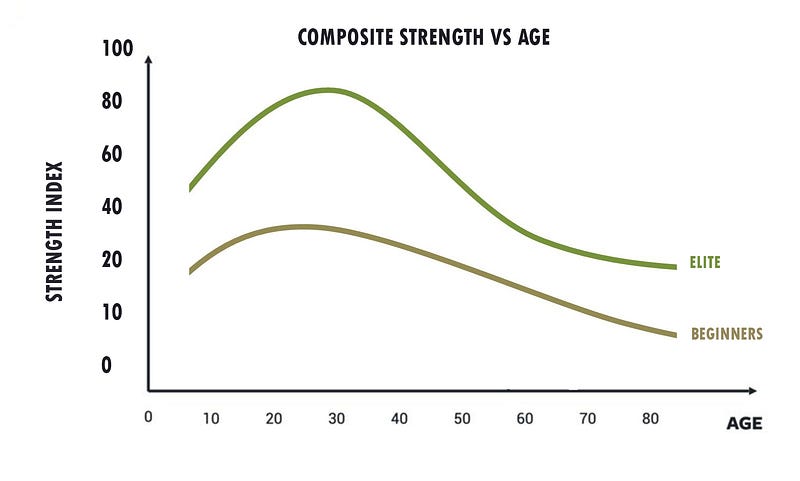
Training dominates the relatively modest effect of age, at least outside of age extremes. And now let’s look at the same factor (influence of age & training) on endurance (using the proxy of VO2 max).
Actually, we used to think it looked like a straight line, like this, but this isn’t quite correct:
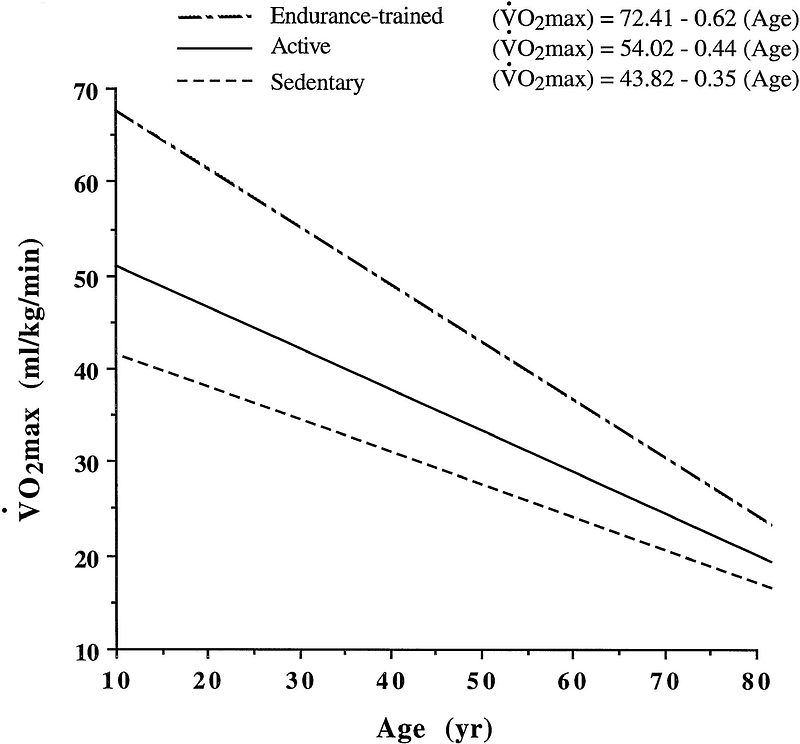
In a study of 810 people followed for 8 years, Fleg et al. (2005) (linkref) clarified that the decline is not linear, with a larger rate of decline after 60 years.
It actually looks like this (pretty much the same as strength effects above):
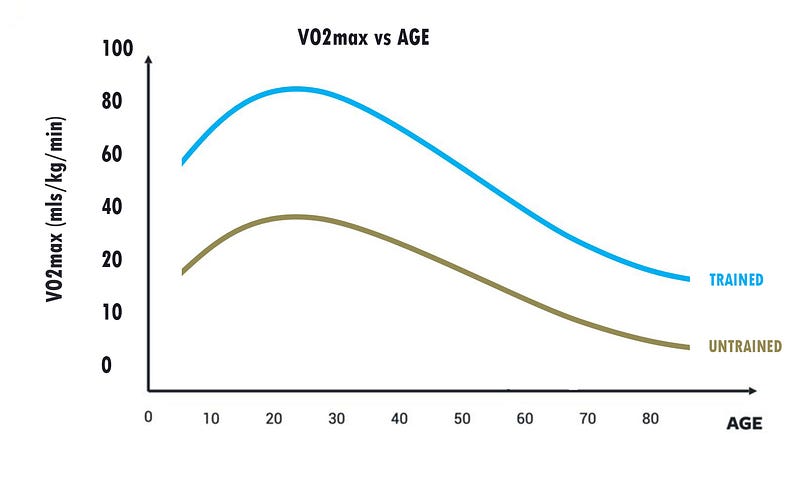
Now, if you take the difference between these two groups, i.e., trained and untrained, then it looks like this plot (red), and this is an indication of how much you gain in absolute terms if you start training at a specific age.
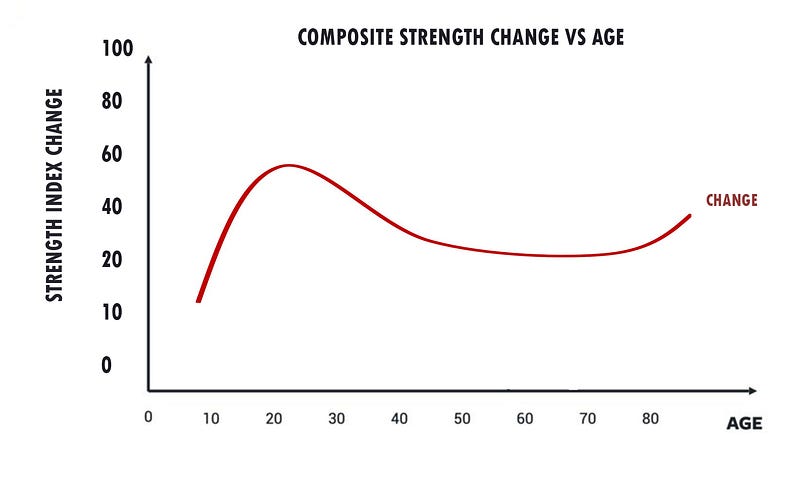
BUT WAIT, there is another plot, which I have never seen before, it is the plot of the relative gains (vs untrained) you get by training (=(trained-untrained)/trained), and this is even more dramatic!
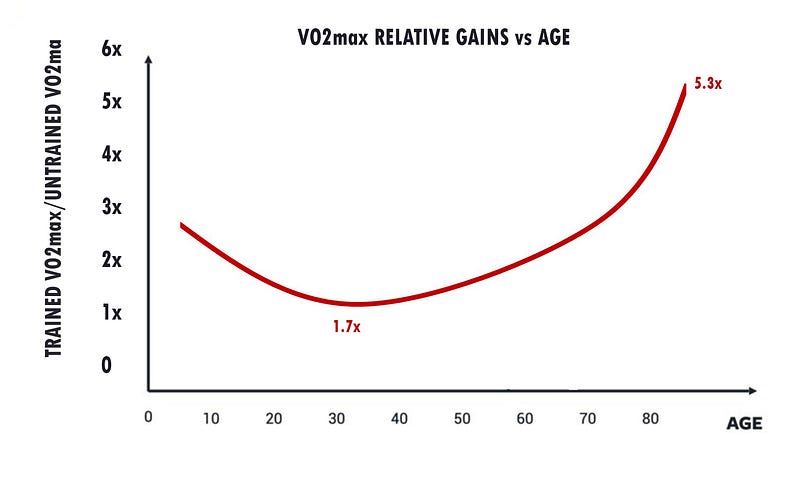
What these last two graphs show is that you make the largest, fastest absolute gains at an early age, but you never fail to benefit from training. In fact, if you didn’t train before (or had a big gap) then you should definitely begin to train later in life as the benefits are really large *relative to the norms* at your age. Not sure? Ok, try this…
group
Please consider these three brothers: Tony, Javier and Deter

Each had a different lifestyle and each had a test on the bicycle ergometer every 10 years.
Tony is now 58yrs, and untrained after a life behind a desk. His VO2 max is 18. Even at 30 yrs his VO2 max best was 28.
Javier is also 58yrs but he is a regular triathlete age grouper. His VO2 max is 44 and at its best was 66.
Deter is 68yrs and he was always active and even now, does an online gym and spin class. His VO2 max is 27 but at his best was 49. Confused? OK, here is all their VO2 max test results (from past and future) from every decade lined up:
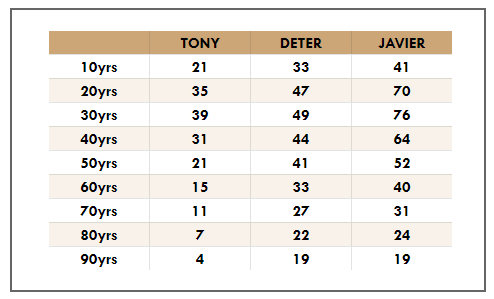
Tony’s VO2 max is in danger of impacting on his independence, if not mortality from 70yrs. Indeed, Posner et al. (linkpdf) showed that the ability to perform activities of daily living was not dependent on aerobic fitness until peak V̇o2 dropped below ≈750 mL/min (or around 12 ml/min @ 60kg).
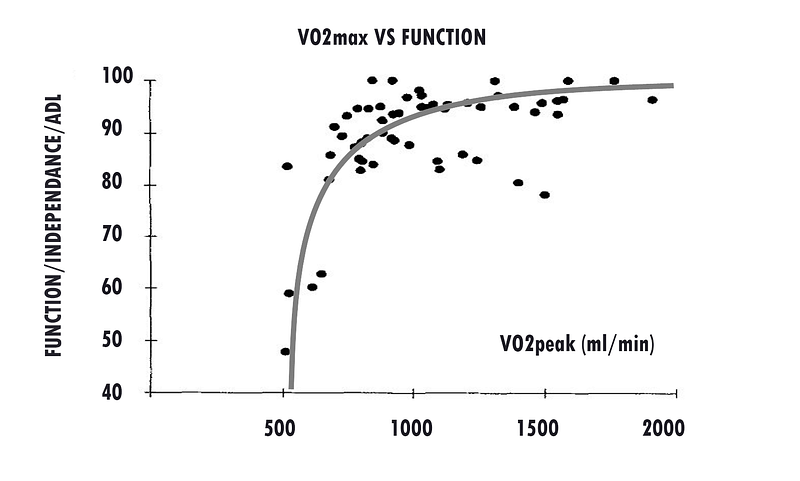
Javier’s VO2 max is almost 2.5x Tony’s. Deter, despite being 10 years older, has a healthy VO2 max, still 1.7x Tony’s and he will stay healthy well into his 90s.
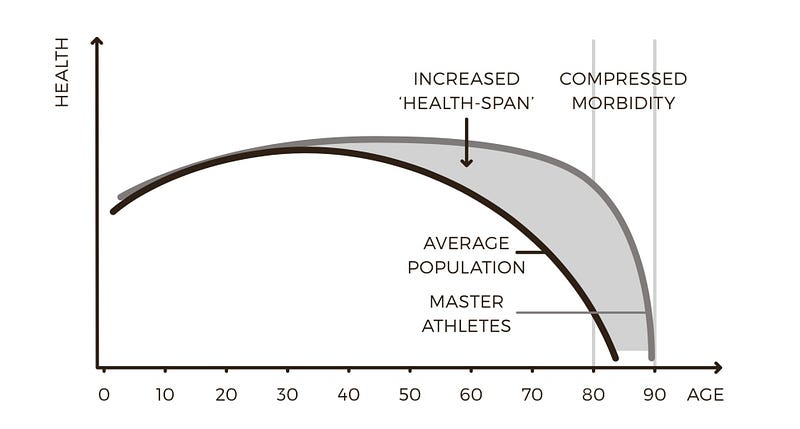
This massive relative benefit of training with age will maximise quality of life, so that healthy living lasts longer and morbidity / illness / dependency is much less as shown here:
done_all
Conclusion
Some decline in performance is inevitable with age but the good news is you can vastly mitigate this by training consistently. In fact, the older you are, then the more relative benefit you will get from training. So if you have had a big gap in your training, or you are new to training in your 50s, 60s or 70s then now is the perfect time to restart.
In the next blog, we will consider the mechanisms by which we age. It’s linkhere.
menu_book
Citations and Further Reading
Strait, J. B., & Lakatta, E. G. (2012). Aging-associated cardiovascular changes and their relationship to heart failure. Heart Failure Clinics, 8(1), 143–164. Link
Fleg, J. L., Morrell, C. H., Bos, A. G., Brant, L. J., Talbot, L. A., Wright, J. G., & Lakatta, E. G. (2005). Accelerated longitudinal decline of aerobic capacity in healthy older adults. Circulation, 112(5), 674–682. Link
Posner, J. D., Gorman, K. M., Gitlin, L. N., Sands, L. P., Kleban, M., Windsor, L. A., & Shaw, C. (1995). Effects of exercise training in the elderly on the occurrence and time to onset of cardiovascular diagnoses. Journal of the American Geriatrics Society, 43(3), 232–237. PDF
Strongur.io Data Analysis: Age and Strength. www.strongur.io